News
Share of Investors in Financial Instrument Turnover on GPW in 2022
PRESS RELEASE
- Retail investors generated 17 percent of equity turnover on the GPW Main Market in 2022 (-5 pps YoY), domestic institutional investors generated 19 percent (-2 pps YoY), while the share of foreign investors increased by 7 pps to a historically high 64 percent.
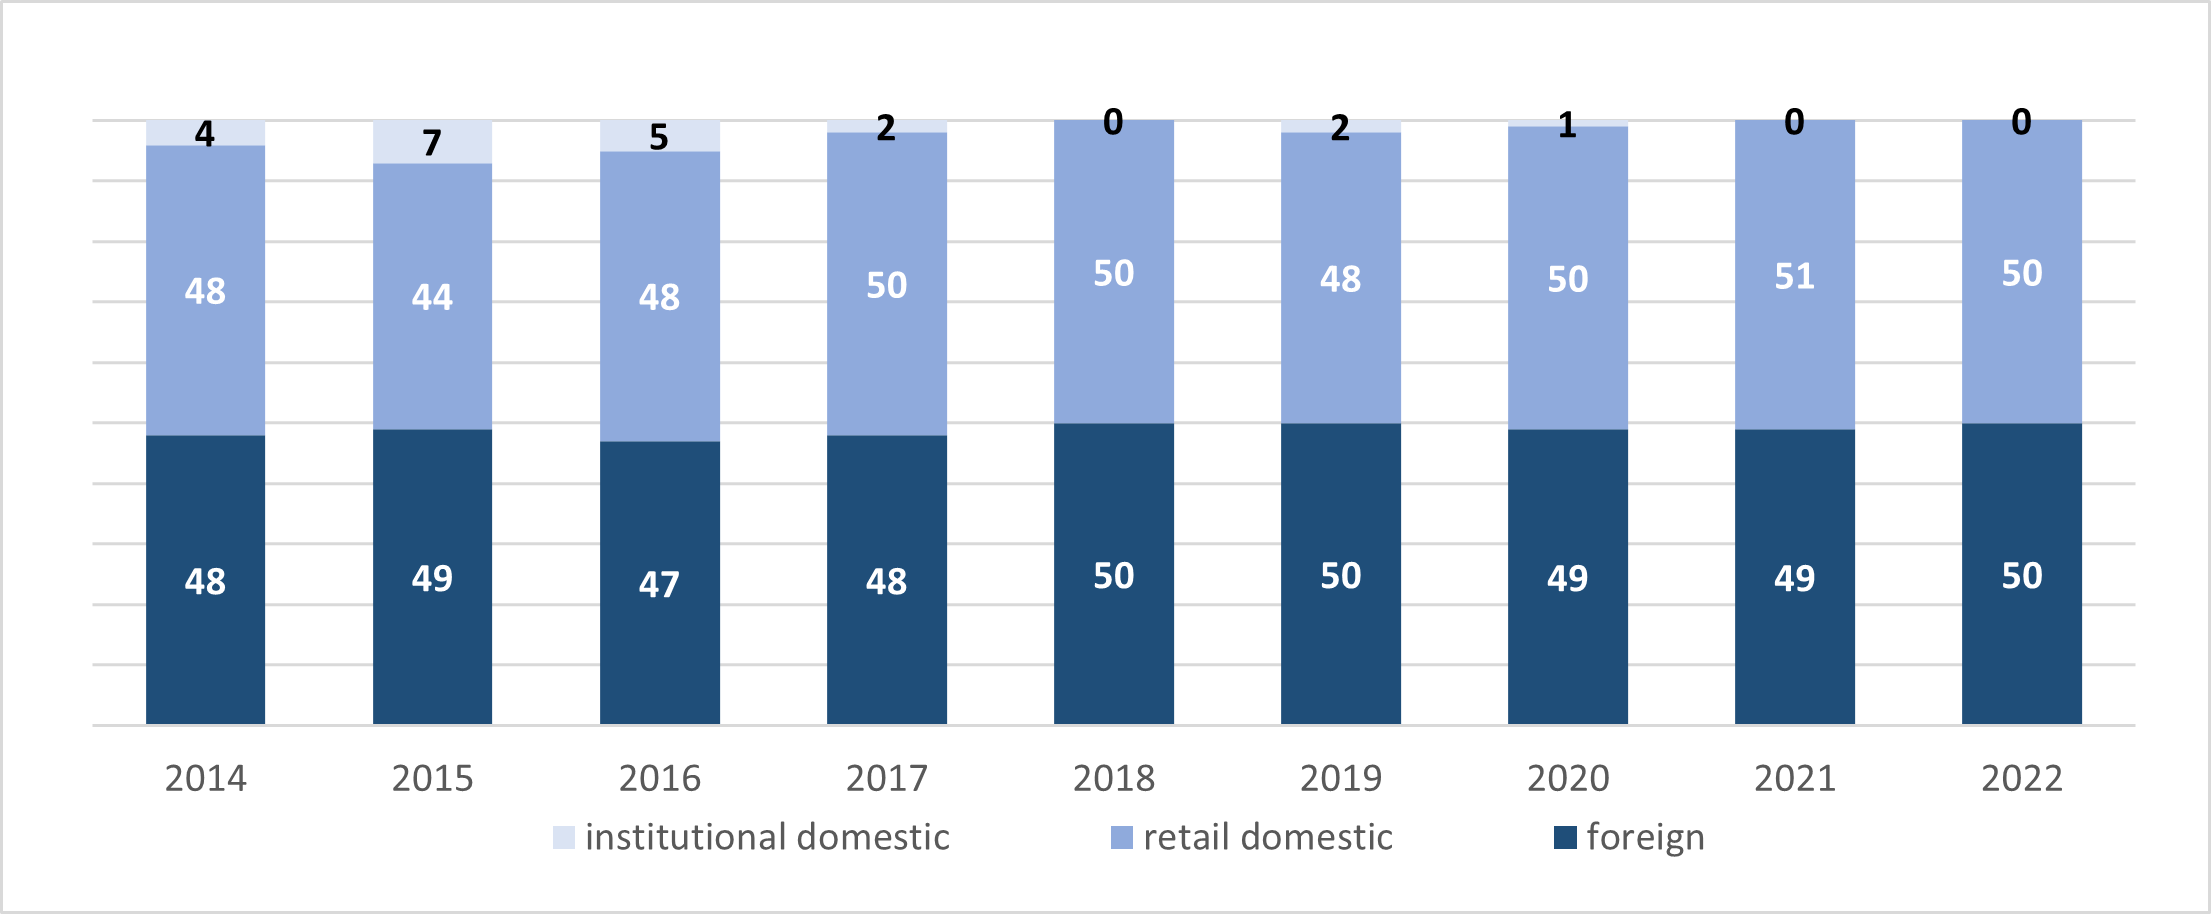
- On NewConnect, domestic retail investors remained in the lead: their share in turnover was 84 percent (-4 pps YoY). The share of domestic institutional investors grew to 11 percent (+4 pps YoY). The share of foreign investors decreased to 5 percent (-1 pps YoY).
- Foreign investors had the biggest share in derivatives turnover in 2022 for the first time in history: they generated 38 percent (+11 pps YoY). The share of retail investors increased by 3 pps YoY to 35 percent of turnover. The share of institutional investors decreased by 14 pps to 27 percent.
GPW Main Market
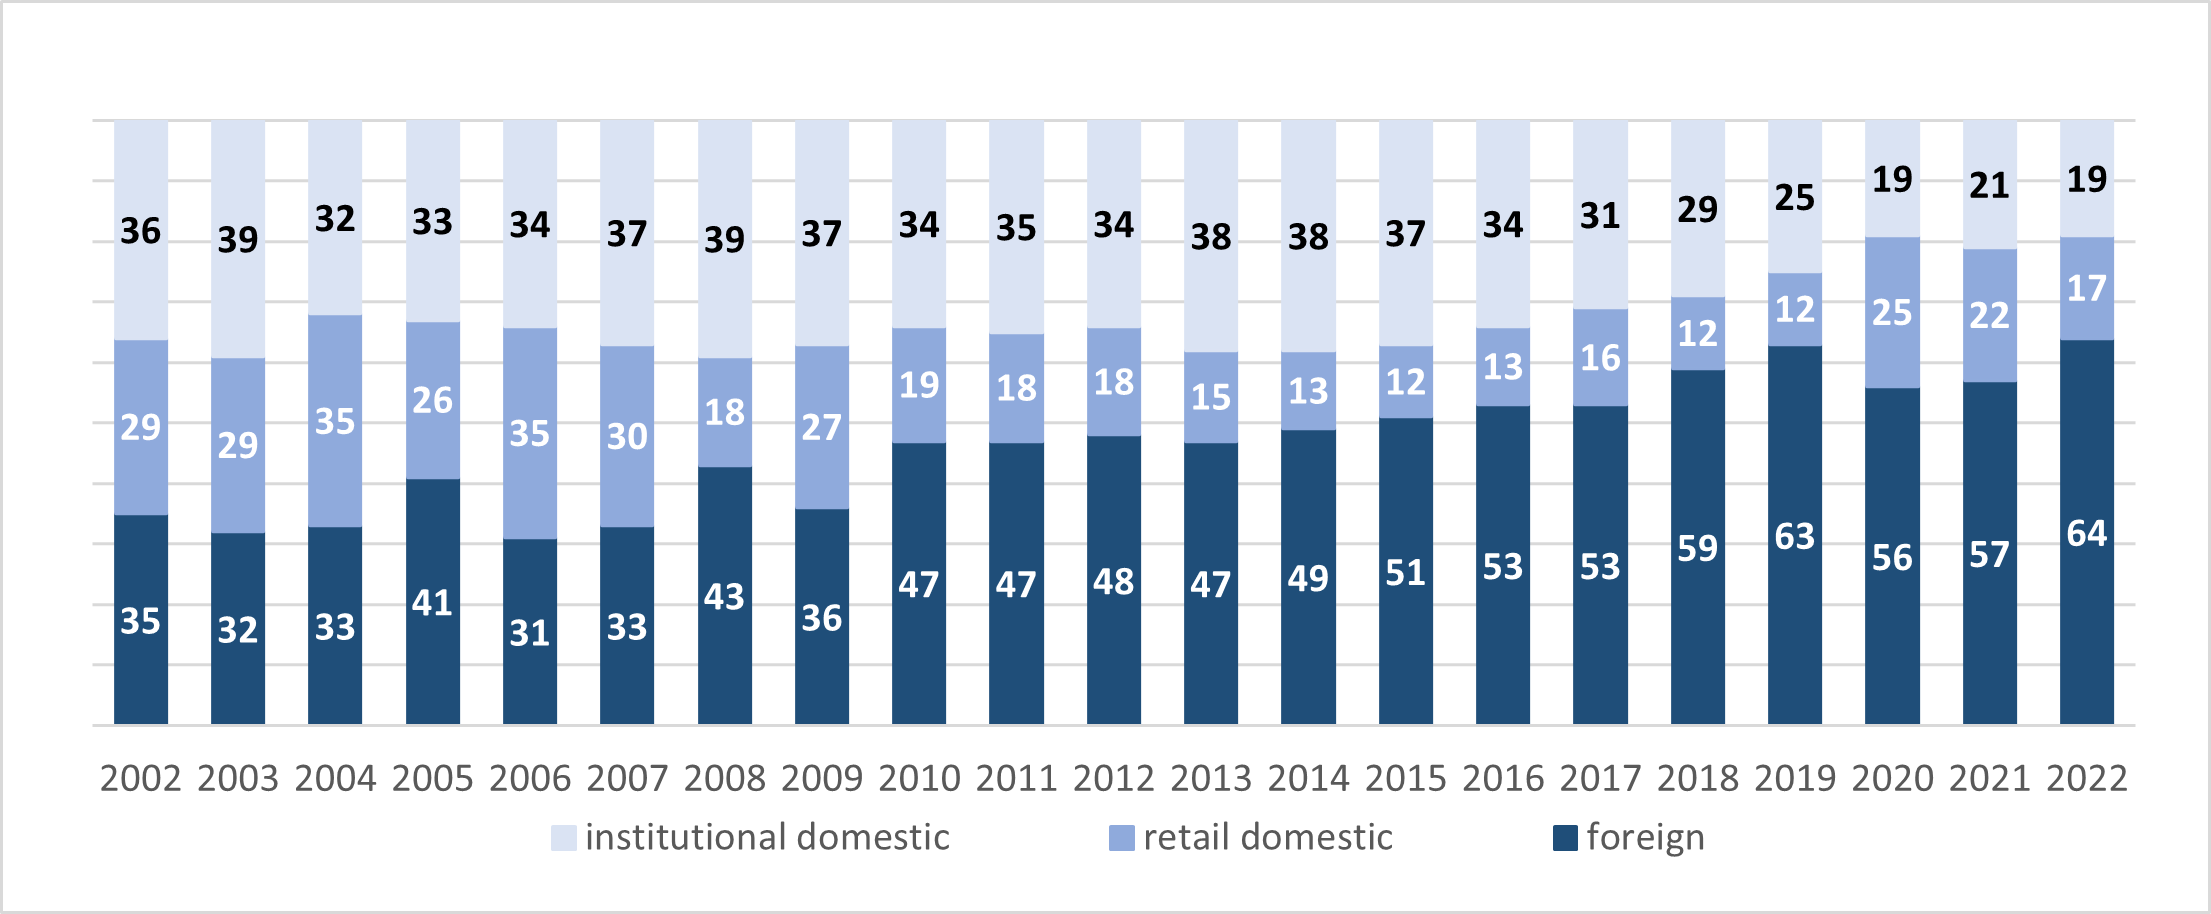
Foreign investors contributed the biggest share to equity turnover on the GPW Main Market in 2022, as in previous years. They generated 64 percent of turnover, i.e., 7 percentage points more than in 2021 and the highest share ever. Foreign investors generated 64 percent of turnover in H2 2022, i.e., 1 percentage point more than in H1 2022. Domestic institutional investors generated 19 percent of turnover in 2021, 2 percentage points less than in 2021. Institutional investors generated 20 percent of turnover in H2 2022, 1 percentage point more than in H1 2022. The share of retail investors in turnover on the GPW Main Market was 17 percent in 2022, down by 5 percentage points year on year. Retail investors generated 16 percent of turnover in H2 2022, 2 percentage points less than in H1 2022.
Other institutions[1] (with a share of 29.4 percent) were the leading group of domestic institutions in H2 2022, followed by market makers (27.4 percent) and firms[2] (17 percent).
Table 1. Investor mix on the Main Market in equities [%]
Source: GPW data based on Exchange Members’ broker orders
NewConnect
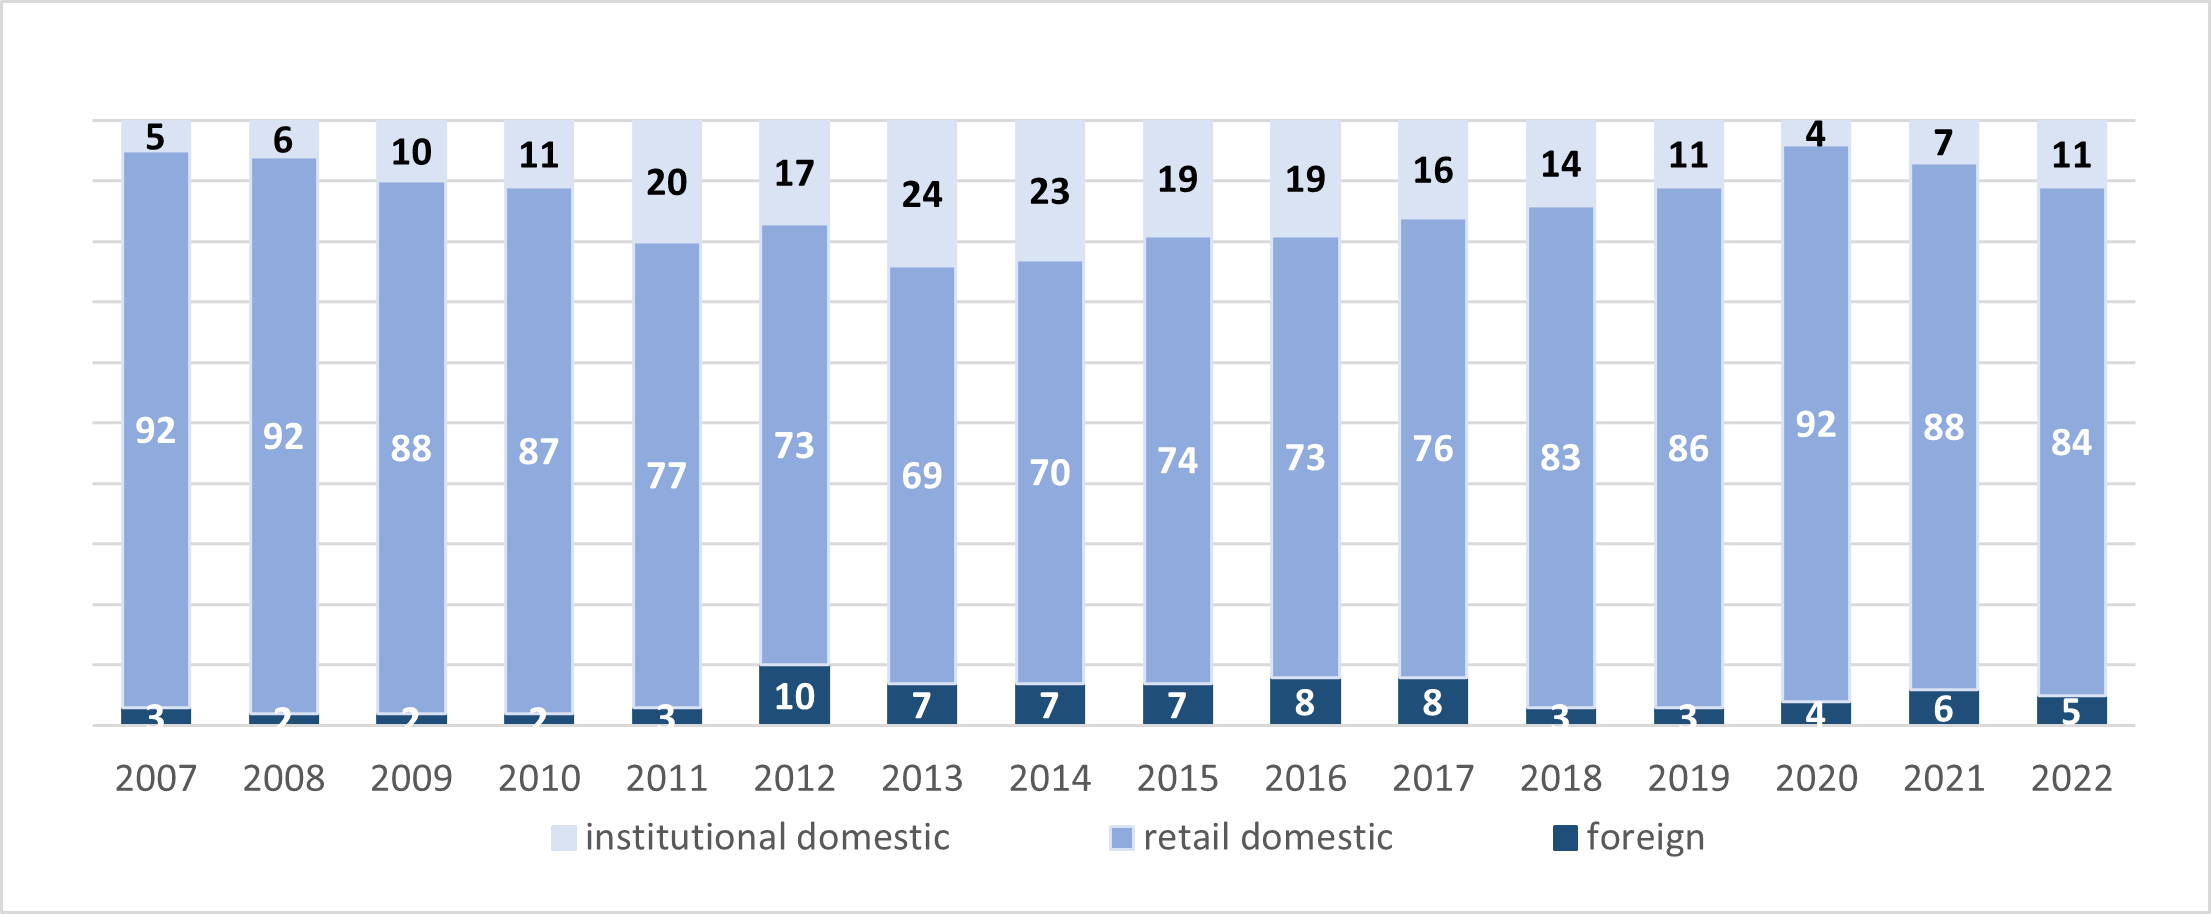
On NewConnect, domestic retail investors had the biggest share of turnover at 84 percent in 2022, down by 4 percentage points year on year. The share of retail investors in turnover in H2 2021 was 86 percent, an increase of 4 percentage points compared to H1 2022. The share of institutional investors was 11 percent, up by 4 percentage points year on year; the share of foreign investors was 5 percent (down by 1 percentage point year on year). The share of institutional investors and foreign investors in turnover in H2 2022 was 10 percent (down by 1 percentage point YoY) and 4 percent (down by 2 percentage points YoY) respectively.
In H2 2022, firms were the leading domestic institutions on NewConnect (39 percent of equity turnover) followed by market makers (32.6 percent) and other entities (21.7 percent).
Table 2. Investor mix on NewConnect [%]
Source: GPW data based on Exchange Members’ broker orders
Derivatives Market
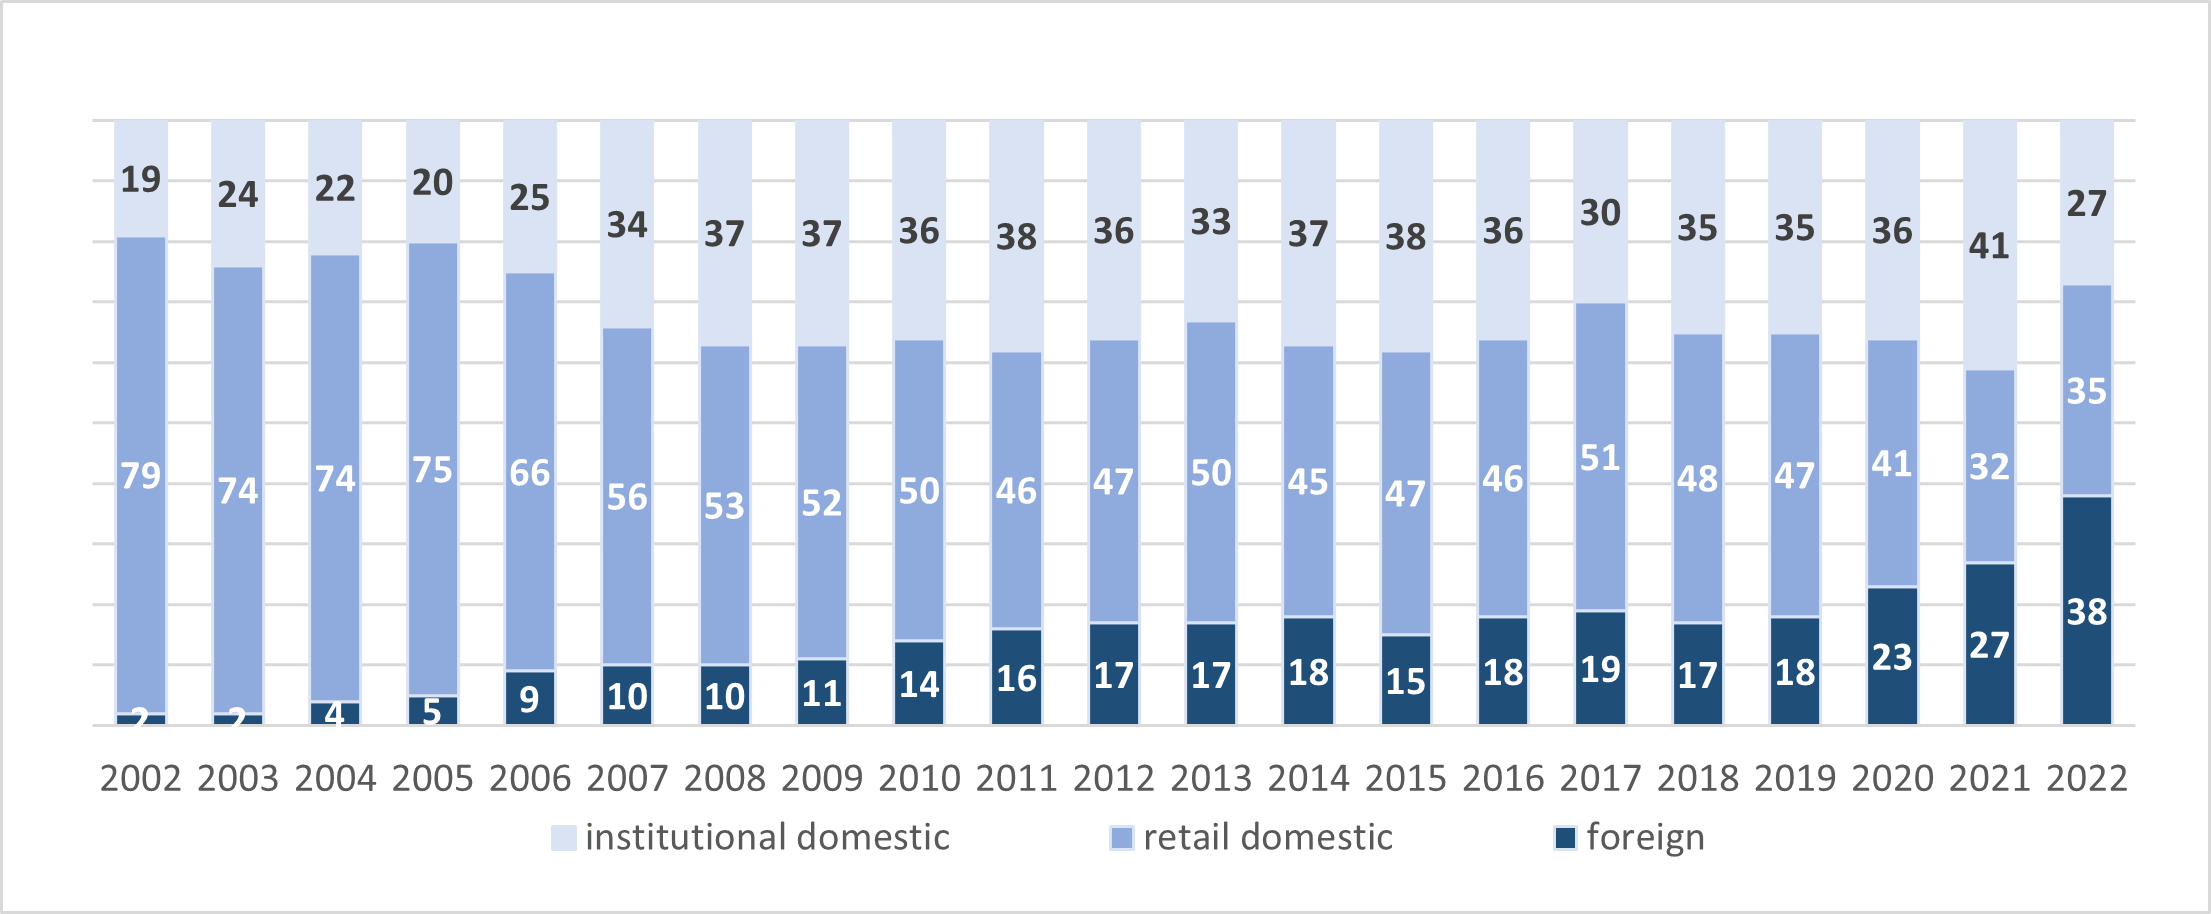
Foreign investors were in the lead on the derivatives market in 2022 and generated a record high share of 38 percent of turnover, an increase of 11 percentage points year on year. Domestic retail investors generated 35 percent of the derivatives turnover volume, up by 3 percentage points year on year. Domestic institutions accounted for 27 percent of derivatives turnover, down by 14 percentage points year on year. The share of retail investors in options turnover increased by 5 percentage points year on year to 45 percent while foreign investors and domestic institutional investors accounted for 34 percent (-1 percentage point YoY) and 21 percent (-4 percentage points YoY) respectively. The share of foreign investors and retail investors in structured products turnover was 50 percent each.
Market makers were the leading domestic institutions in futures trading in H2 2022 with a share of 56.5 percent, followed by firms (21.7 percent) and other entities (11.8 percent). Firms prevailed in options turnover with a share of 55.4 percent, followed by market makers (42.5 percent) and investment funds (1.9 percent). In H2 2022, Exchange Members were in the lead in structured products turnover (40.1 percent) followed by firms (30.2 percent) and market makers (29.4 percent).
Table 3. Investor mix on the futures market [%]
Source: GPW data based on Exchange Members’ broker orders
Table 4. Investor mix on the options market [%]
Source: GPW data based on Exchange Members’ broker orders
Table 5. Investor mix on the structured products market [%]
Source: GPW data based on Exchange Members’ broker orders
Catalyst
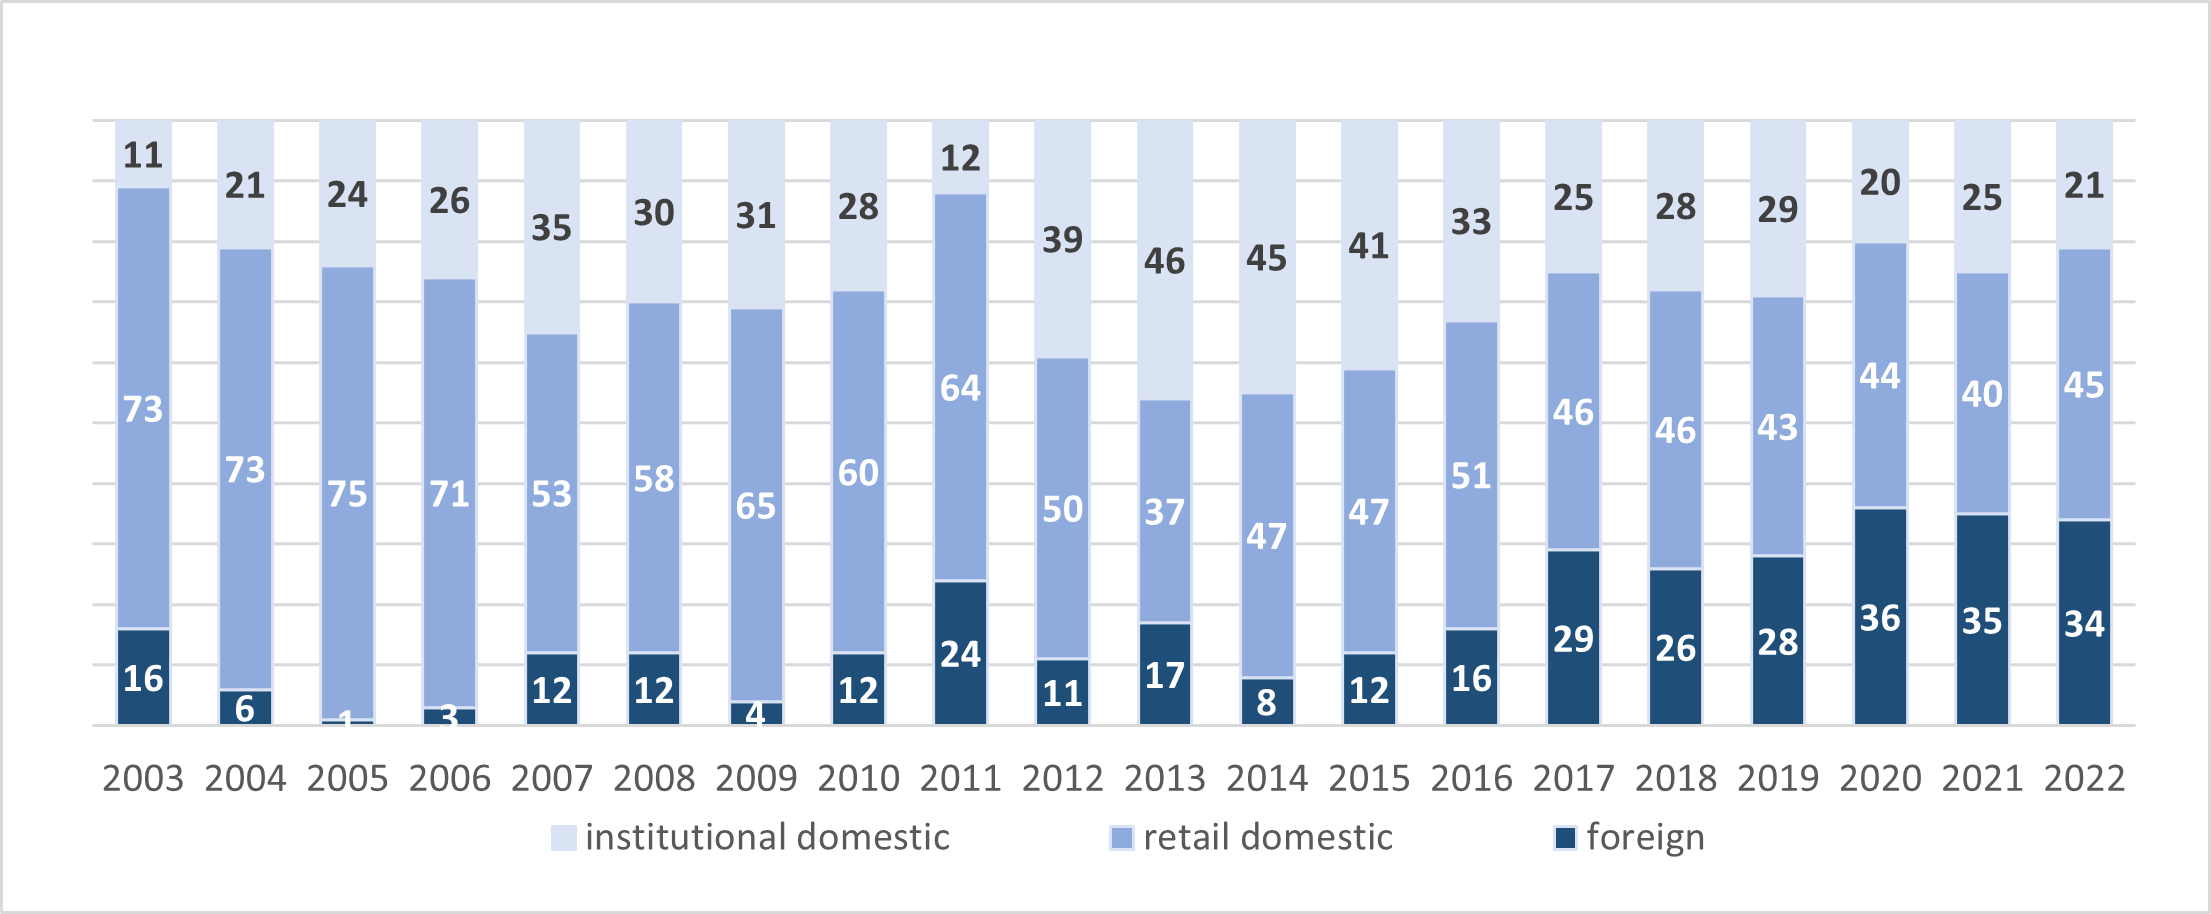
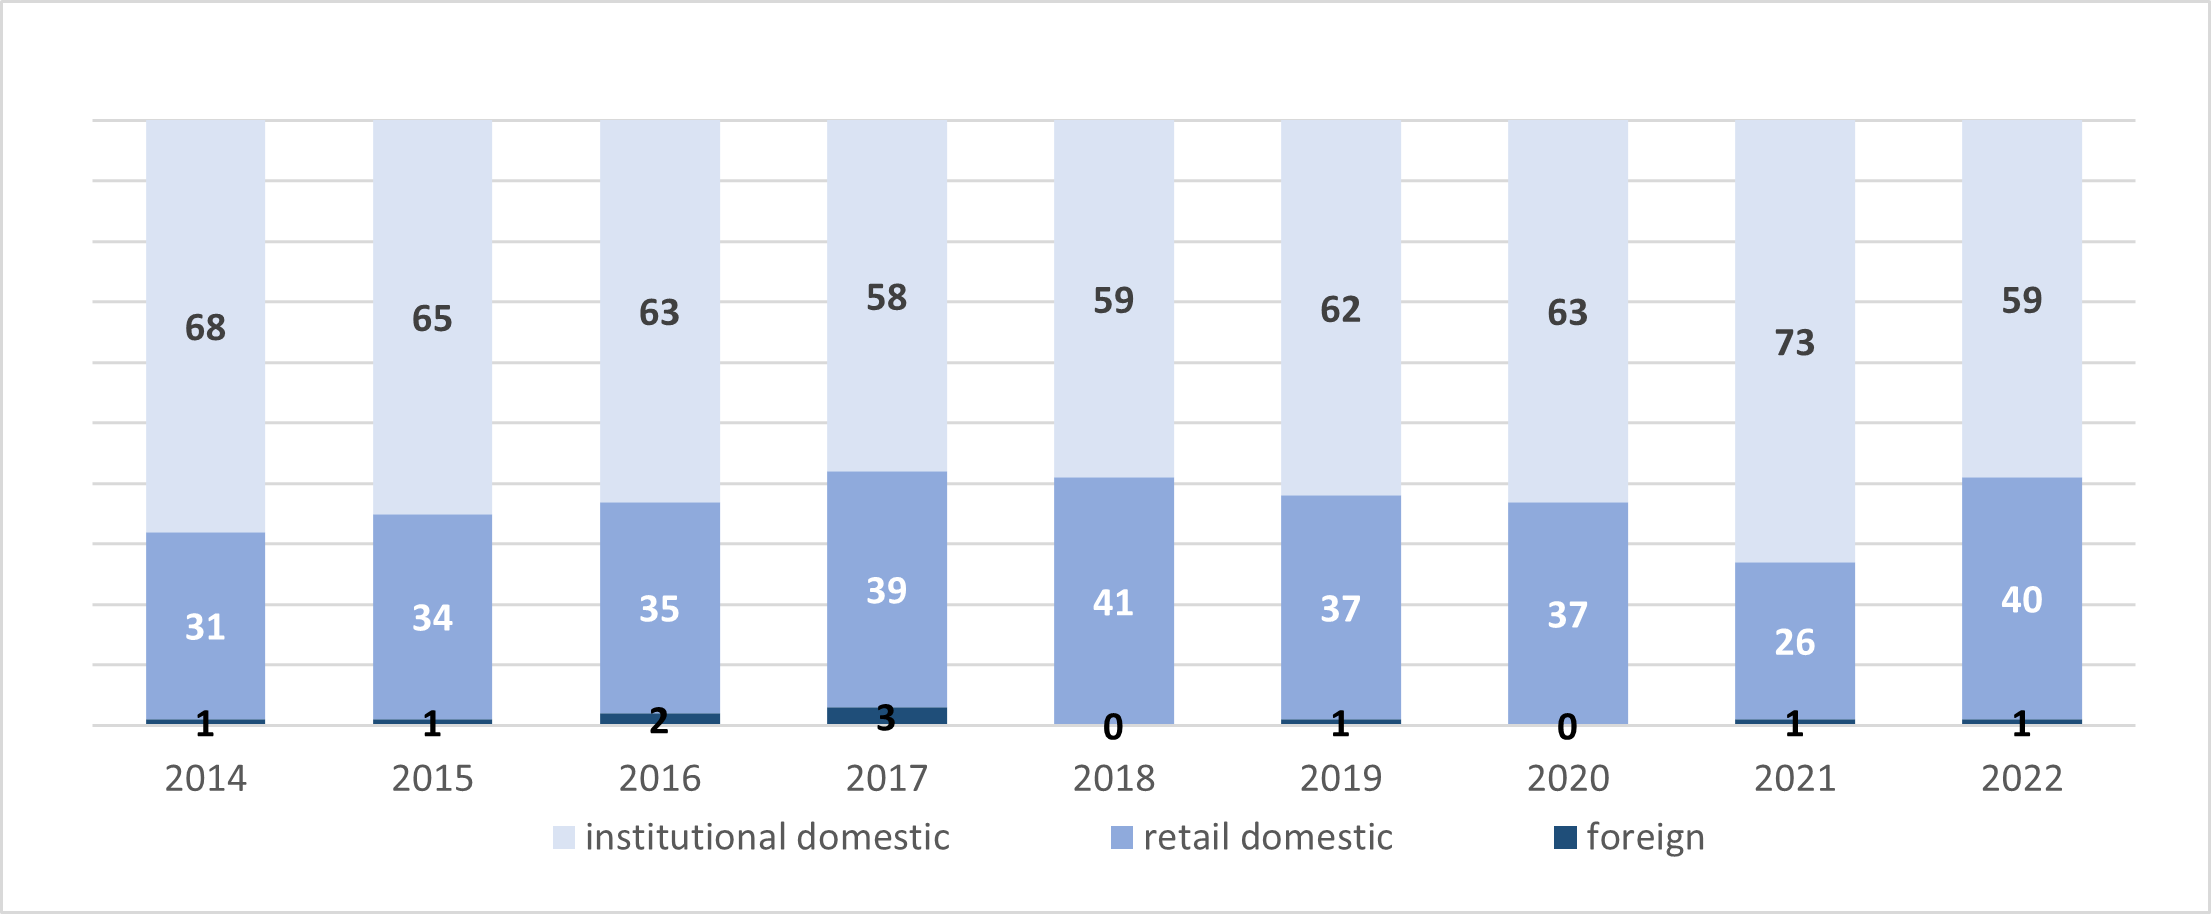
Bond turnover on Catalyst is dominated by domestic institutions which generated 59 percent of turnover in 2022, down by 14 percentage points year on year. Retail investors generated 40 percent of turnover (+14 pps YoY) while foreign investors generated 1 percent (the same as in 2021).
Table 6. Investor mix on the bond market [%]
Source: GPW data based on Exchange Members’ broker orders
The detailed results of the survey concerning the share of investors in financial instruments turnover are published on the GPW website at https://www.gpw.pl/analysis-investor-share-in-trading.
In presenting the data in 2021, GPW changed the method used to obtain data for calculating the share of investor groups in turnover on the exchange. Such information is now based on broker orders submitted to the Exchange’s trading system. As a result, the method of aggregating and presenting data on the percentage share of domestic retail investors was modified. The information on the number of online accounts is sourced from surveys conducted by GPW among domestic brokerage houses. The information on the number of active investment accounts comes from the Exchange’s trading system: it is the number of accounts for which at least one order was placed with GPW in the period under review.
***
The Warsaw Stock Exchange Group (GPW Group) operates trading platforms for shares, Treasury and corporate bonds, derivatives, electricity and gas, and provides indices and benchmarks including WIBOR and WIBID. The index agent FTSE Russell classifies the Polish capital market as a Developed Market since 2018. The markets operated by the GPW Group are the biggest in Central and Eastern Europe. For more information, visit www.gpw.pl.
[1] OTHER: Other institutions not classified in any other category*, including n particular state institutions and enterprises, cooperatives, foundations, associations, local government units, as well as KDPW and transactions concluded on the basis of aggregated orders and pending allocation orders referred to in Article 2(3) of Commission Delegated Regulation (EU) 2017/580.
[2] FIRMS: Non-financial entities, i.e., companies and partnerships, as well as individuals conducting business activity, not included in any of the other categories*
*(Categories of domestic institutions: OFE/PTE, TFI, Banks, Insurance companies, Companies, Market makers, Exchange Members, Others)